
Data-driven decisions for your agency
Understand what actually grows your agency
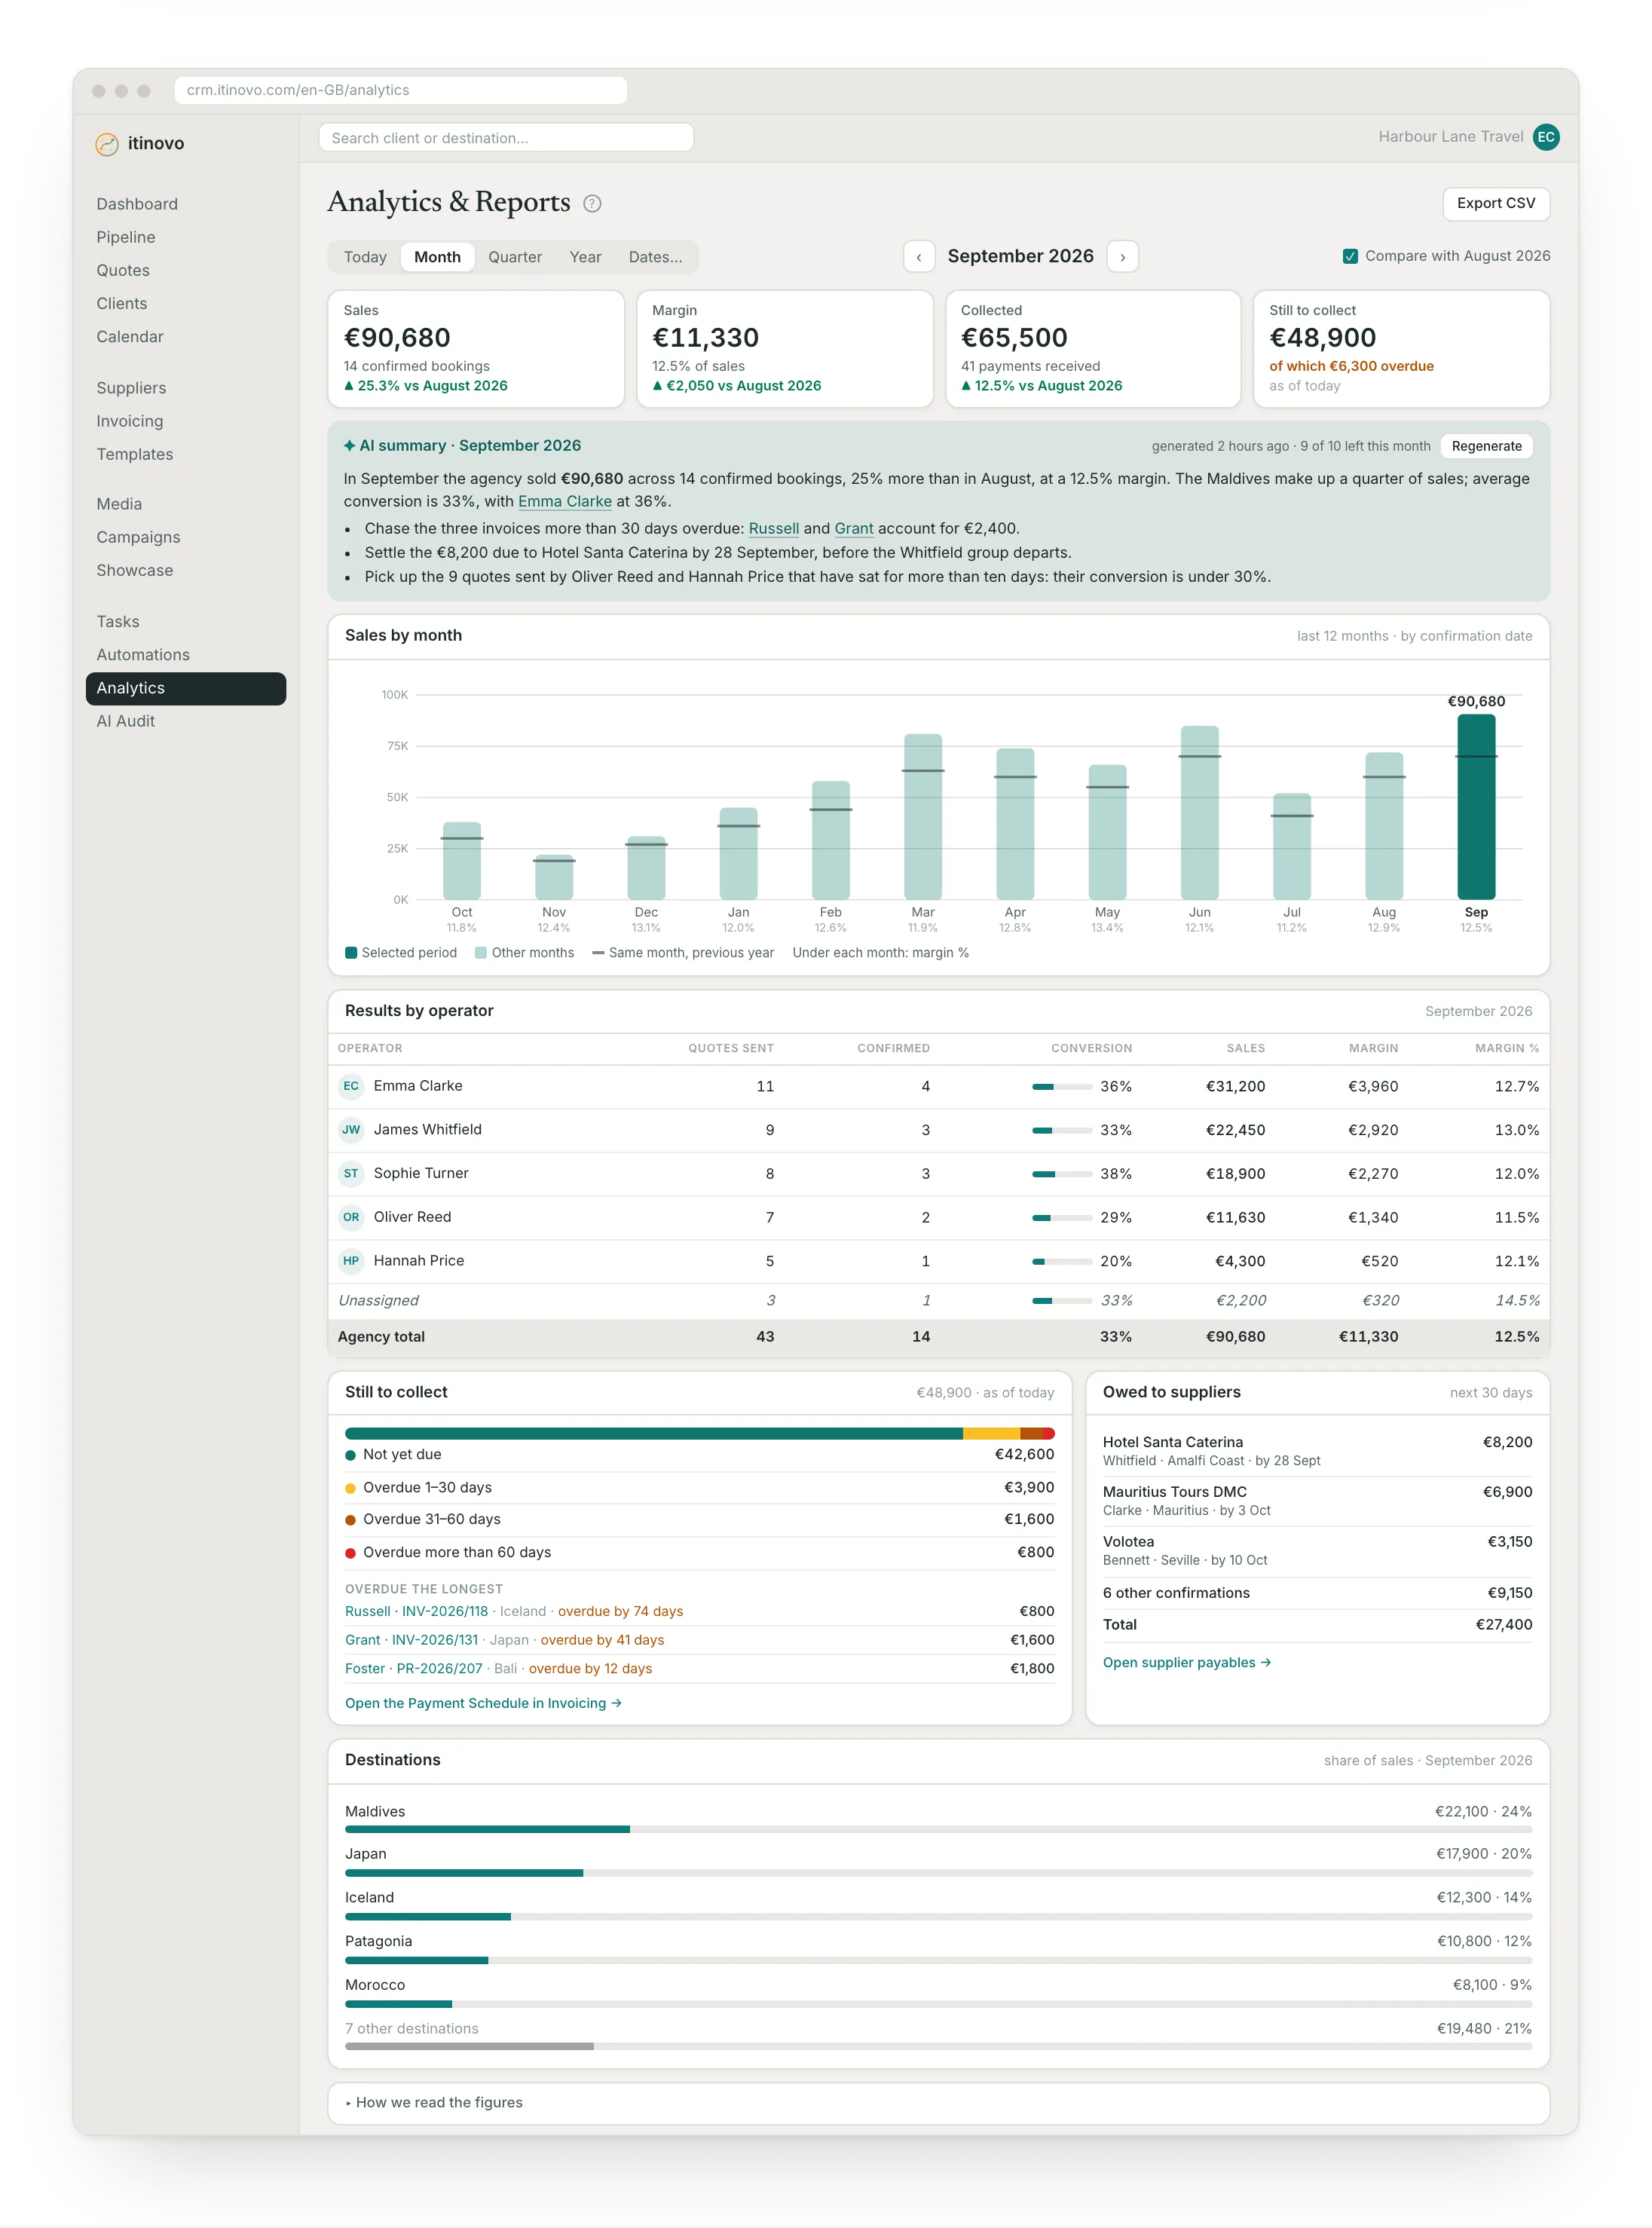
Sales, margin, collected and receivables for the period, results per operator, destinations and an AI-written summary: all from the CRM's real data, with a CSV export. From the Professional plan.
No credit card required · Guided setup · Export your data
Answers to the questions that matter
The questions you ask yourself at month end, answered from your own files.
- 1
How much did you sell, and at what margin?
Sales, margin and collected for the period, compared with the previous period, plus twelve months against the year before.
- 2
Who sells best in the team?
For each operator: quotes sent, bookings confirmed, conversion, sales and margin.
- 3
What is there to collect and to pay?
Receivables by age of overdue, with the oldest highlighted, and supplier payments due in the next 30 days.
Stop guessing, start deciding
Without analytics
- Revenue known only from the accountant, months later
- No idea which destinations are actually profitable
- Conversion rate is a feeling, not a number
- Seasonal patterns discovered too late to act
- Team performance unmeasured and undiscussed
With itinovo CRM
- Revenue and margins visible in real time
- The five top-selling destinations, with their share of sales
- Conversion per operator: quotes sent and bookings confirmed
- Year-on-year comparison to anticipate trends
- Operator performance visible and actionable
More than revenue: understand the full picture
Revenue, margins, conversion rates and trends: all connected to real bookings.
- Revenue and margins under control
- Sales, margin and collected for the period, with the comparison to the previous period and a CSV export.
- A summary written by the AI
- On request, a short text about the figures on the page with up to three things to do, written from the same data.
- Compare seasons and performance
- Analyse month-on-month and year-on-year trends to anticipate dips, peaks and commercial opportunities.
- Year comparison
- Compare revenue and conversion rates across different years.
Frequently asked questions
- What can I actually measure?
- Sales, margin and collected with the comparison to the previous period and twelve months against the year before; receivables and overdue; supplier payments due; results per operator; the five top-selling destinations. Analytics is in the Business plan, for the agency's administrators.
- Is it real analysis or just counters?
- The figures come from the CRM's sales ledger, calculated on confirmed bookings, payments and supplier confirmations: a whole year opens as fast as a month.
- Do I have to remember to go and look?
- A written summary of the period, with the figures that moved and what deserves attention next, arrives by email every week.
Make better decisions with your agency data
Discover which destinations work, where you earn the most, and which opportunities you risk losing.
Start free 30-day trialNo credit card requiredGuided setupExport your data